Project Pulse: Health Monitoring for VS Code
A VS Code extension that gives agencies and freelancers a unified dashboard to monitor SSL certificates, DNS, uptime, security vulnerabilities, and Lighthouse scores across every client project, without leaving the editor.
- Timeline
- 1 month
- Year
- 2026
- Status
- In Progress
Project Pulse is a VS Code extension built for developers who juggle multiple client websites and need to catch issues before their clients do. It transforms the editor into a command center for web project health, continuously monitoring six critical signals across every project you add:
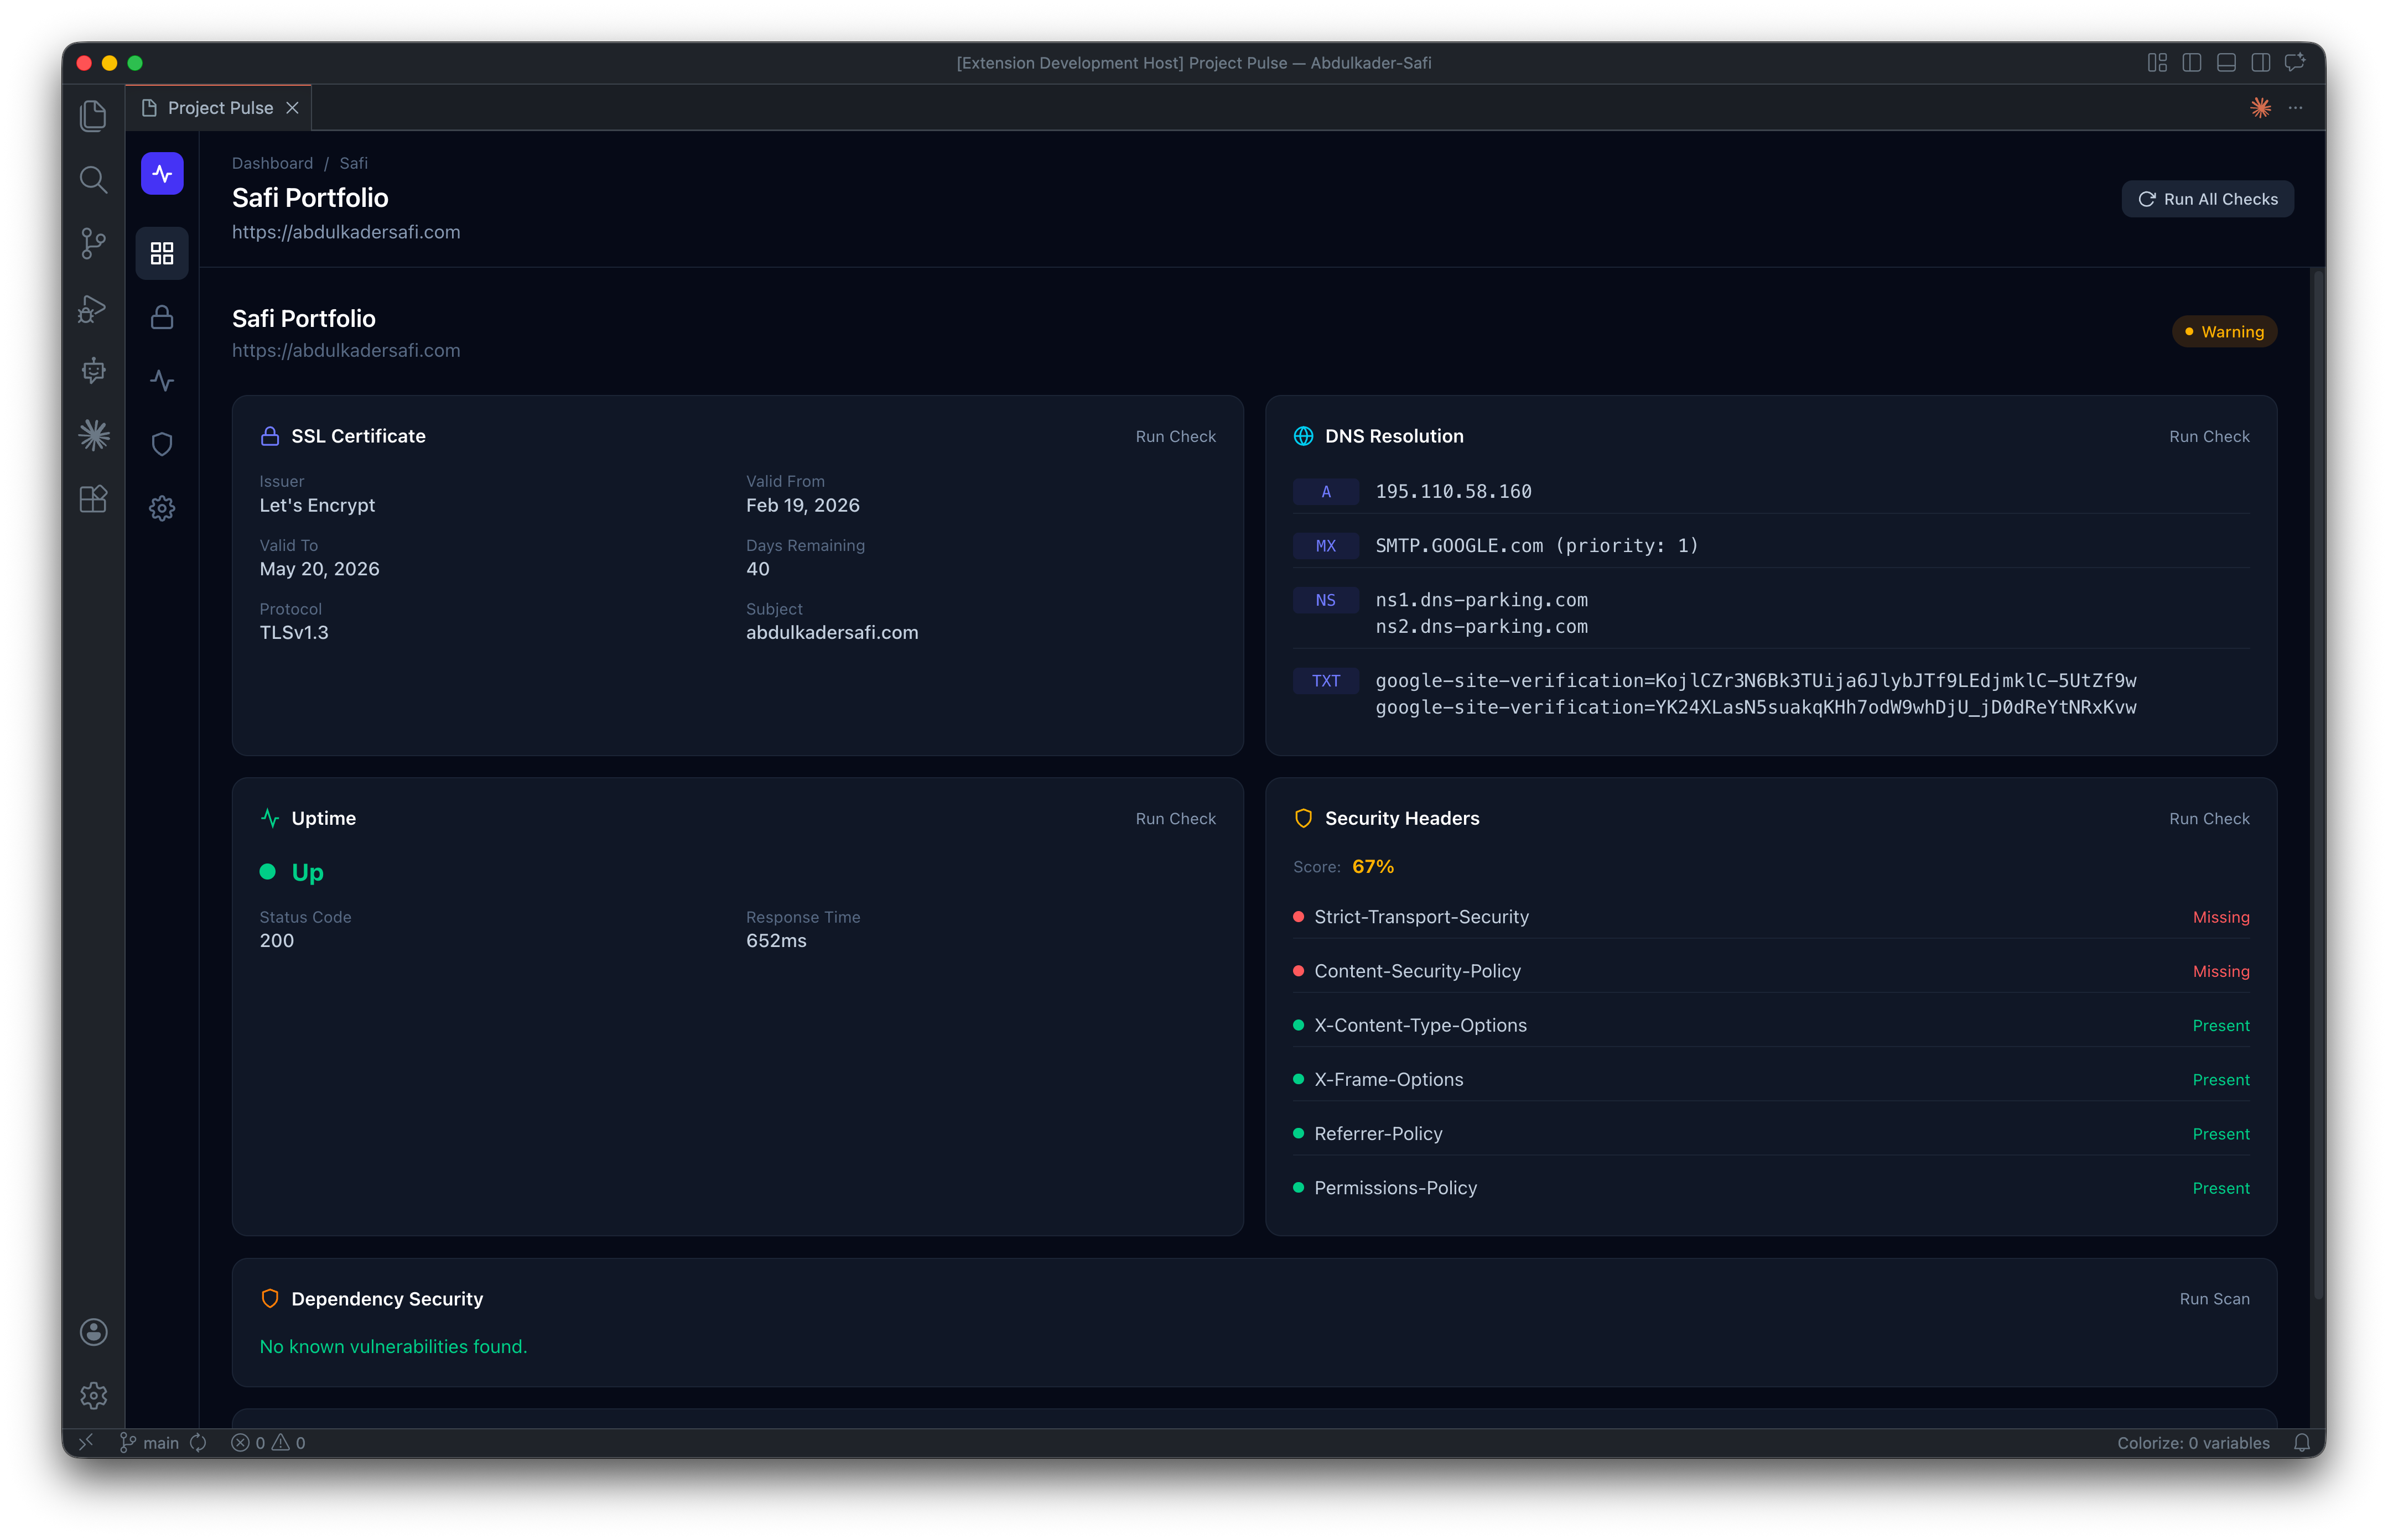
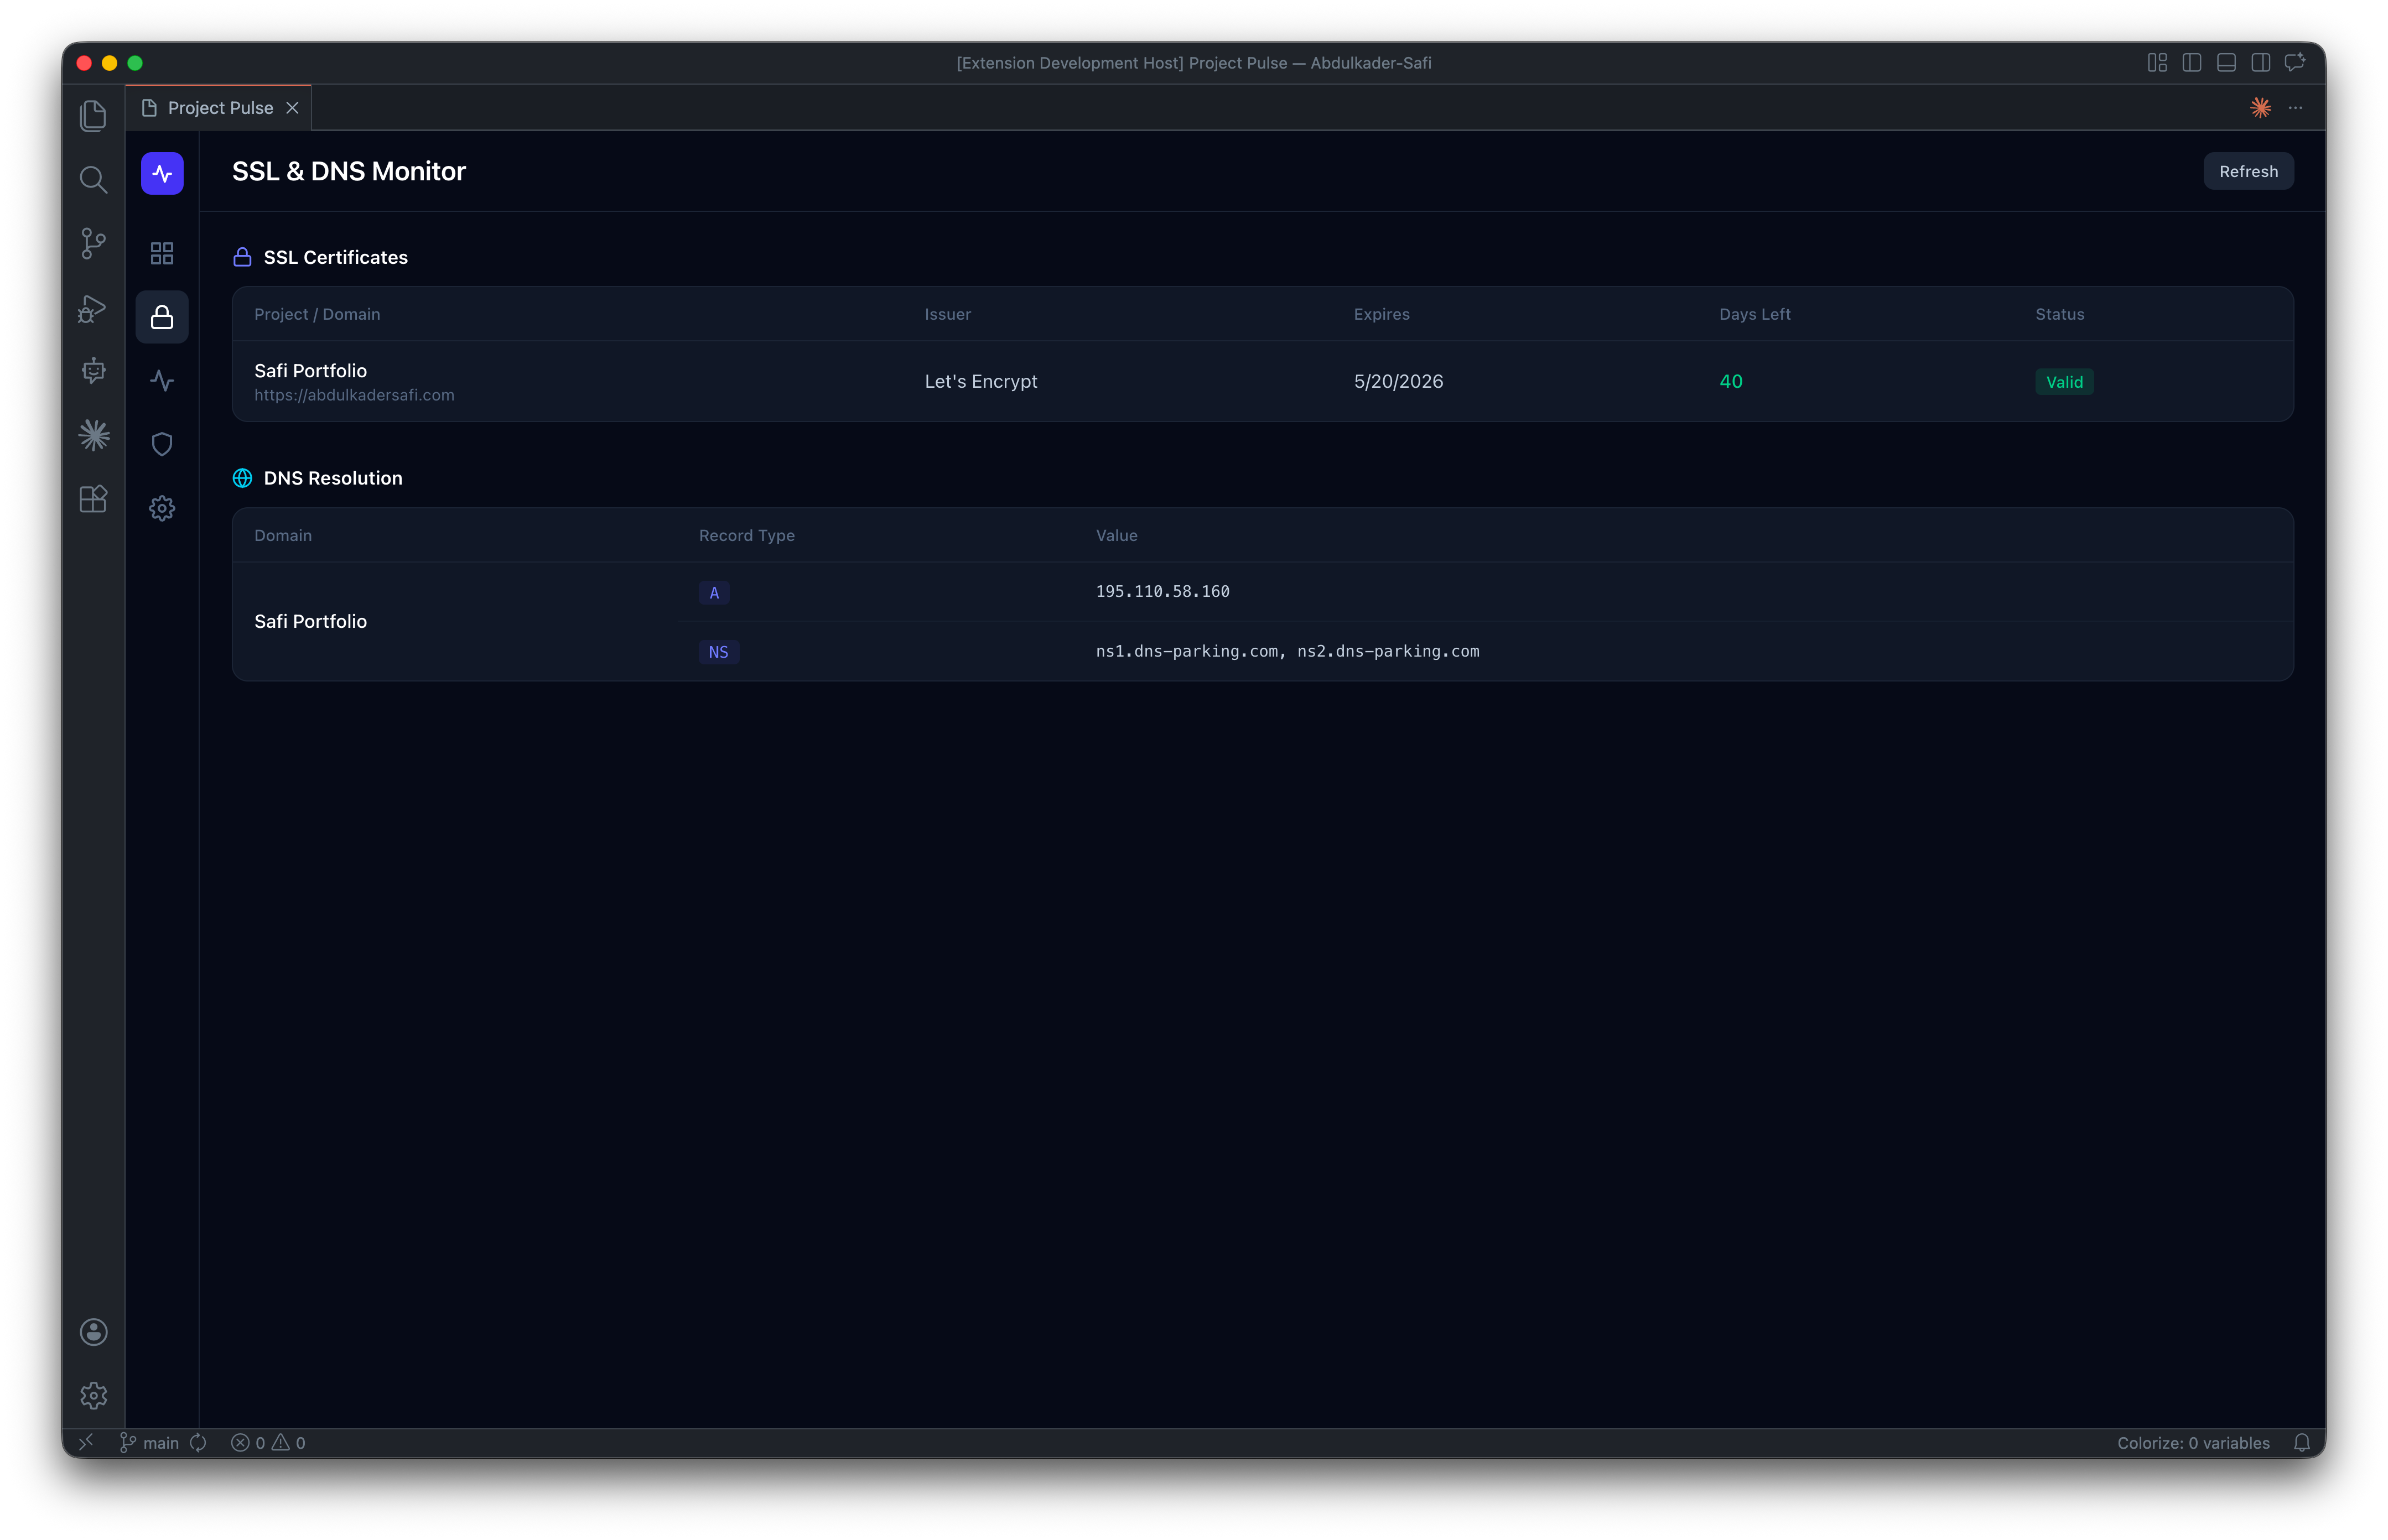
- SSL certificates — expiry, issuer, chain validity, and protocol version
- DNS resolution — A/AAAA/CNAME/MX/NS/TXT records with multi-server propagation checks
- Uptime — response times, status codes, and downtime incidents
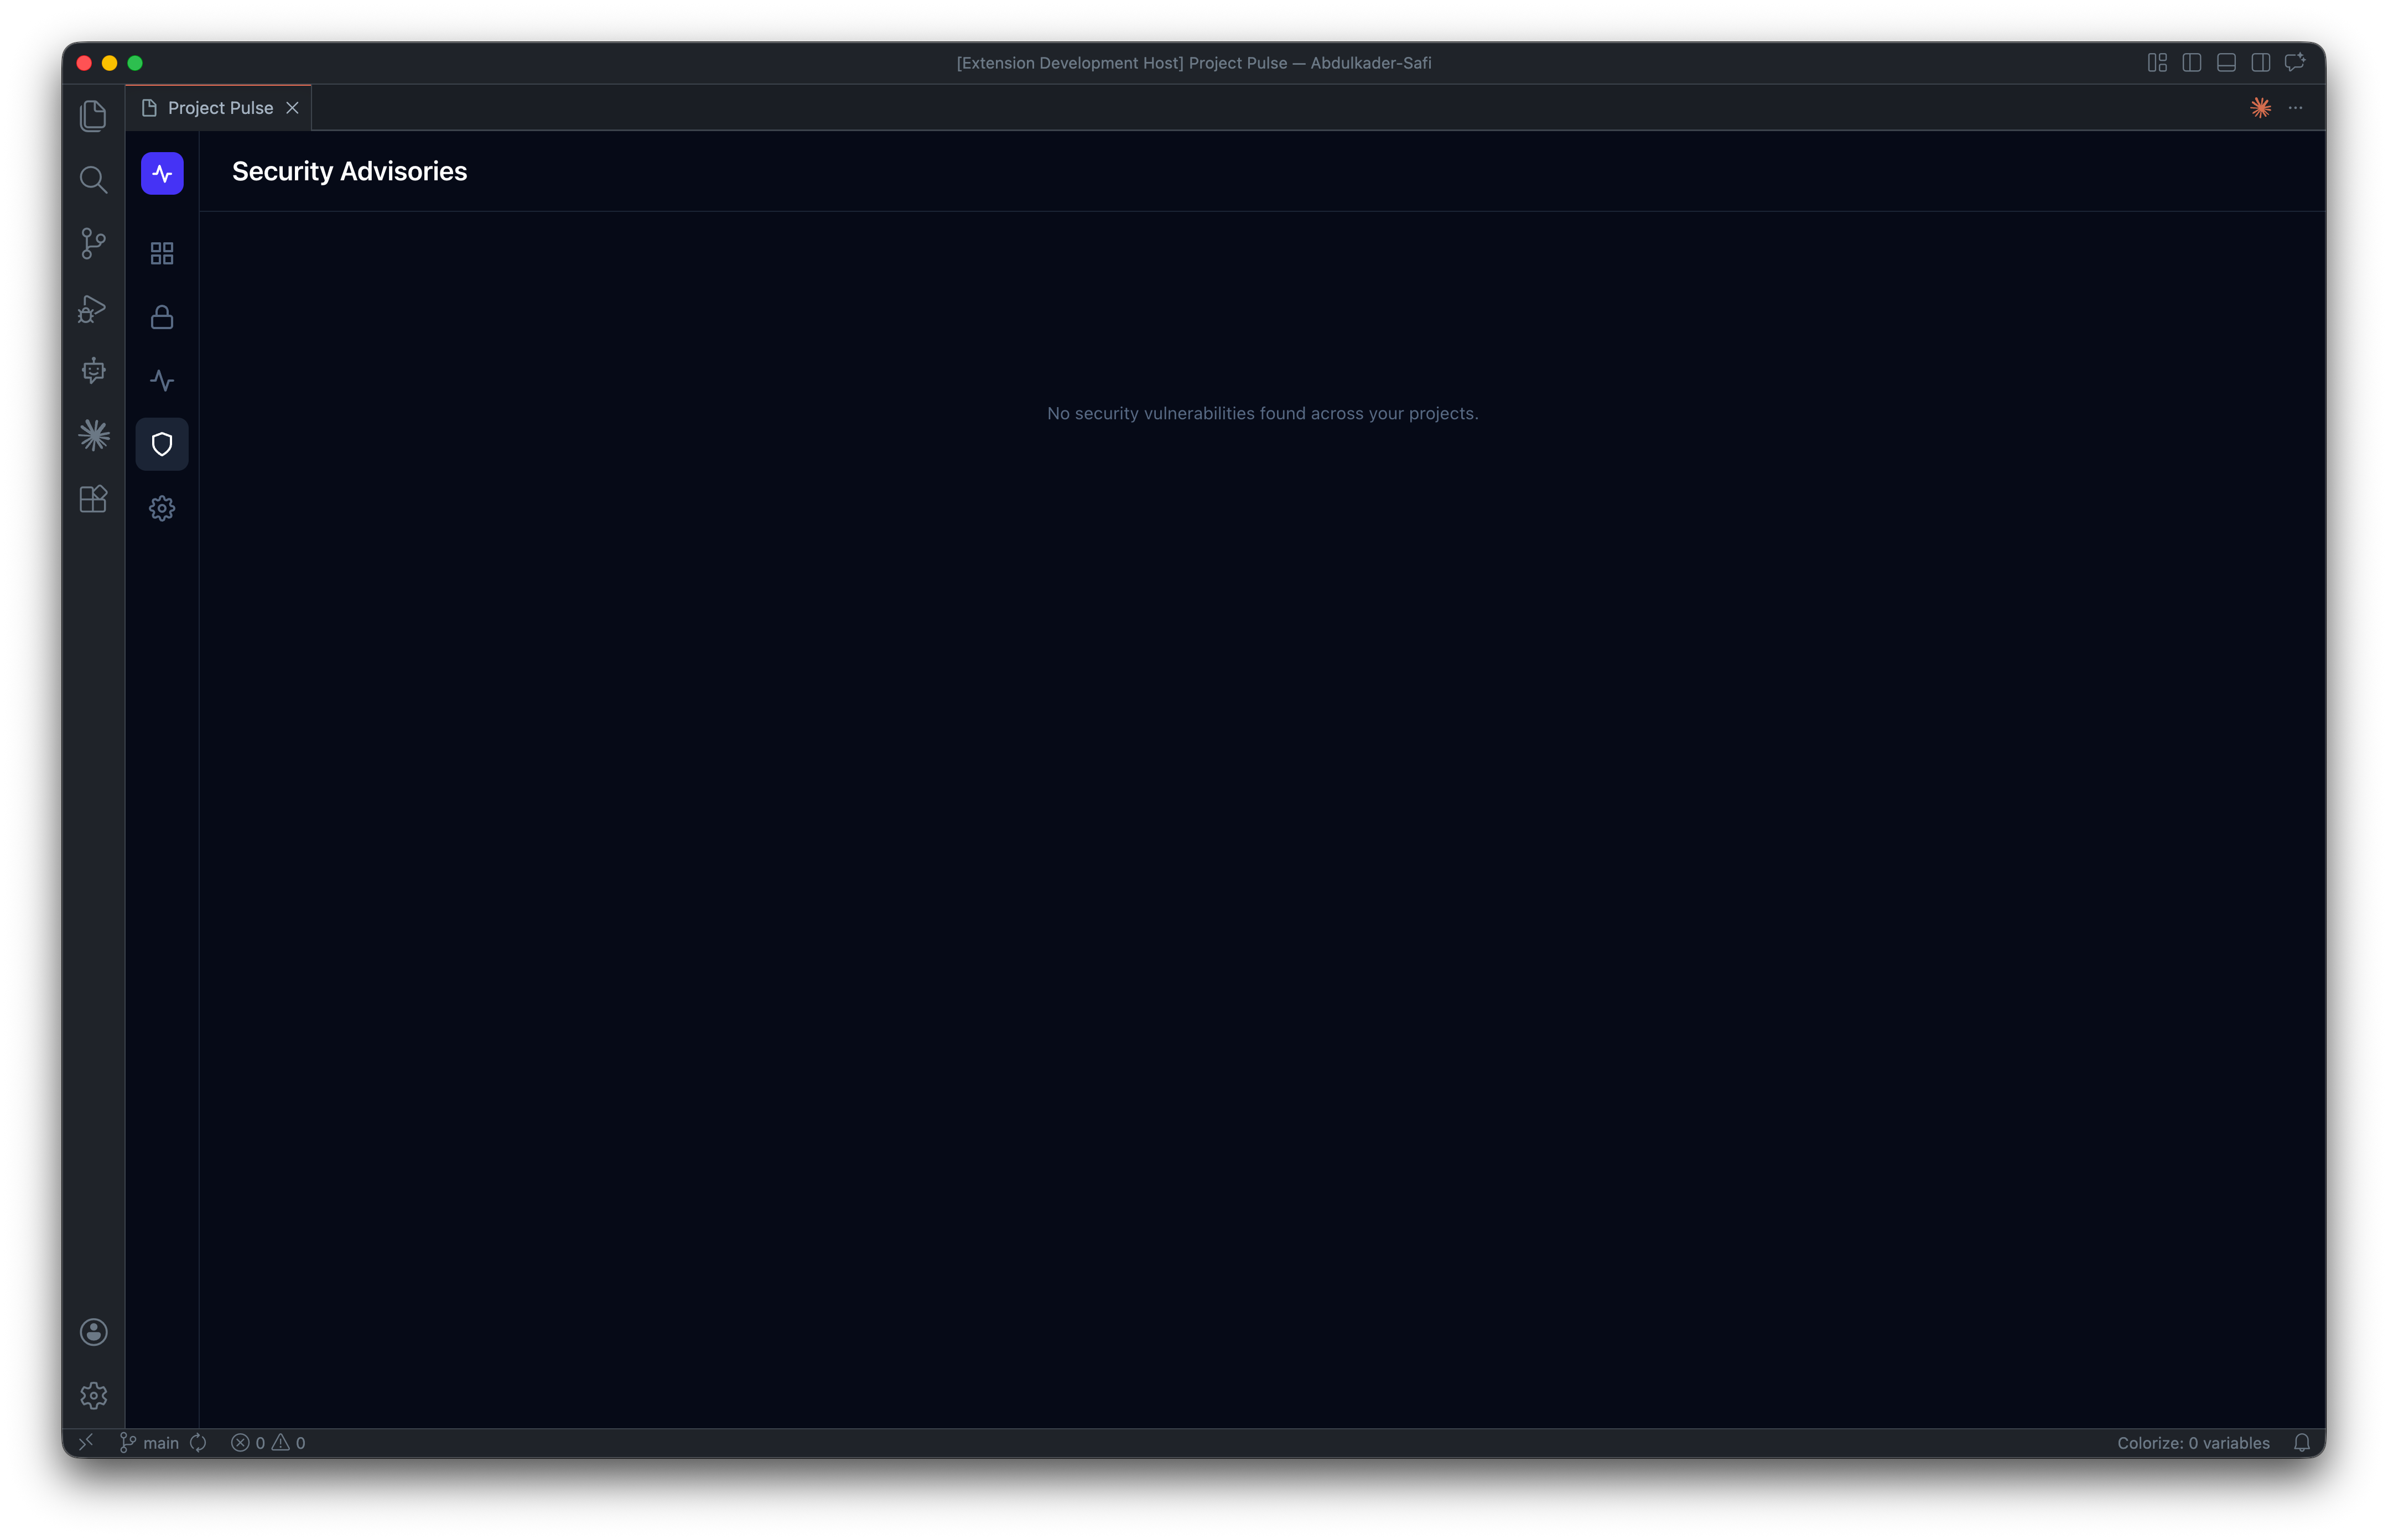
- Dependency security — CVE scanning via
npm auditand the OSV.dev database - Lighthouse performance — scores for performance, accessibility, best practices, and SEO
- HTTP security headers — HSTS, CSP, and five other critical headers
The extension runs entirely in the background while you code. When a certificate is about to expire, a site goes down, or a critical vulnerability lands in your dependencies, Project Pulse fires a native VS Code notification — so you fix it before a client ever notices.
Built with React 19, Tailwind CSS v4, TypeScript, and Node.js built-in modules. Zero external infrastructure, zero subscription fees, zero data leaving your machine.
Agencies and freelance developers typically manage anywhere from 5 to 50 client websites at once — and the operational overhead of keeping all of them healthy is brutal.
The day-to-day reality looks like this:
- An SSL certificate expires on a Sunday and the client's site breaks before Monday morning
- A DNS record gets changed during an unrelated migration and no one notices for three days
- A critical npm vulnerability drops and you have no idea which of your 20 projects are affected
- A client emails asking why their Lighthouse score dropped — and you have no historical data to explain it
- Your CMS stops responding and you find out from the client, not from monitoring
Existing solutions don't fit this workflow:
- Enterprise tools (Datadog, New Relic, Pingdom) cost hundreds of dollars per month and are overkill for small agency portfolios
- Free uptime monitors (UptimeRobot, Better Uptime) only cover one signal — they don't check SSL, DNS, vulnerabilities, or performance
- Manual checks (running
npm audit, opening PageSpeed Insights,openssl s_client) take 10+ minutes per project and nobody actually does them consistently
The fundamental problem: the tools live outside the developer's primary workspace. Context-switching to a separate dashboard, logging in, and clicking through each project creates enough friction that monitoring gets skipped entirely. Issues get discovered by clients instead of developers, which is the worst possible way to find them.
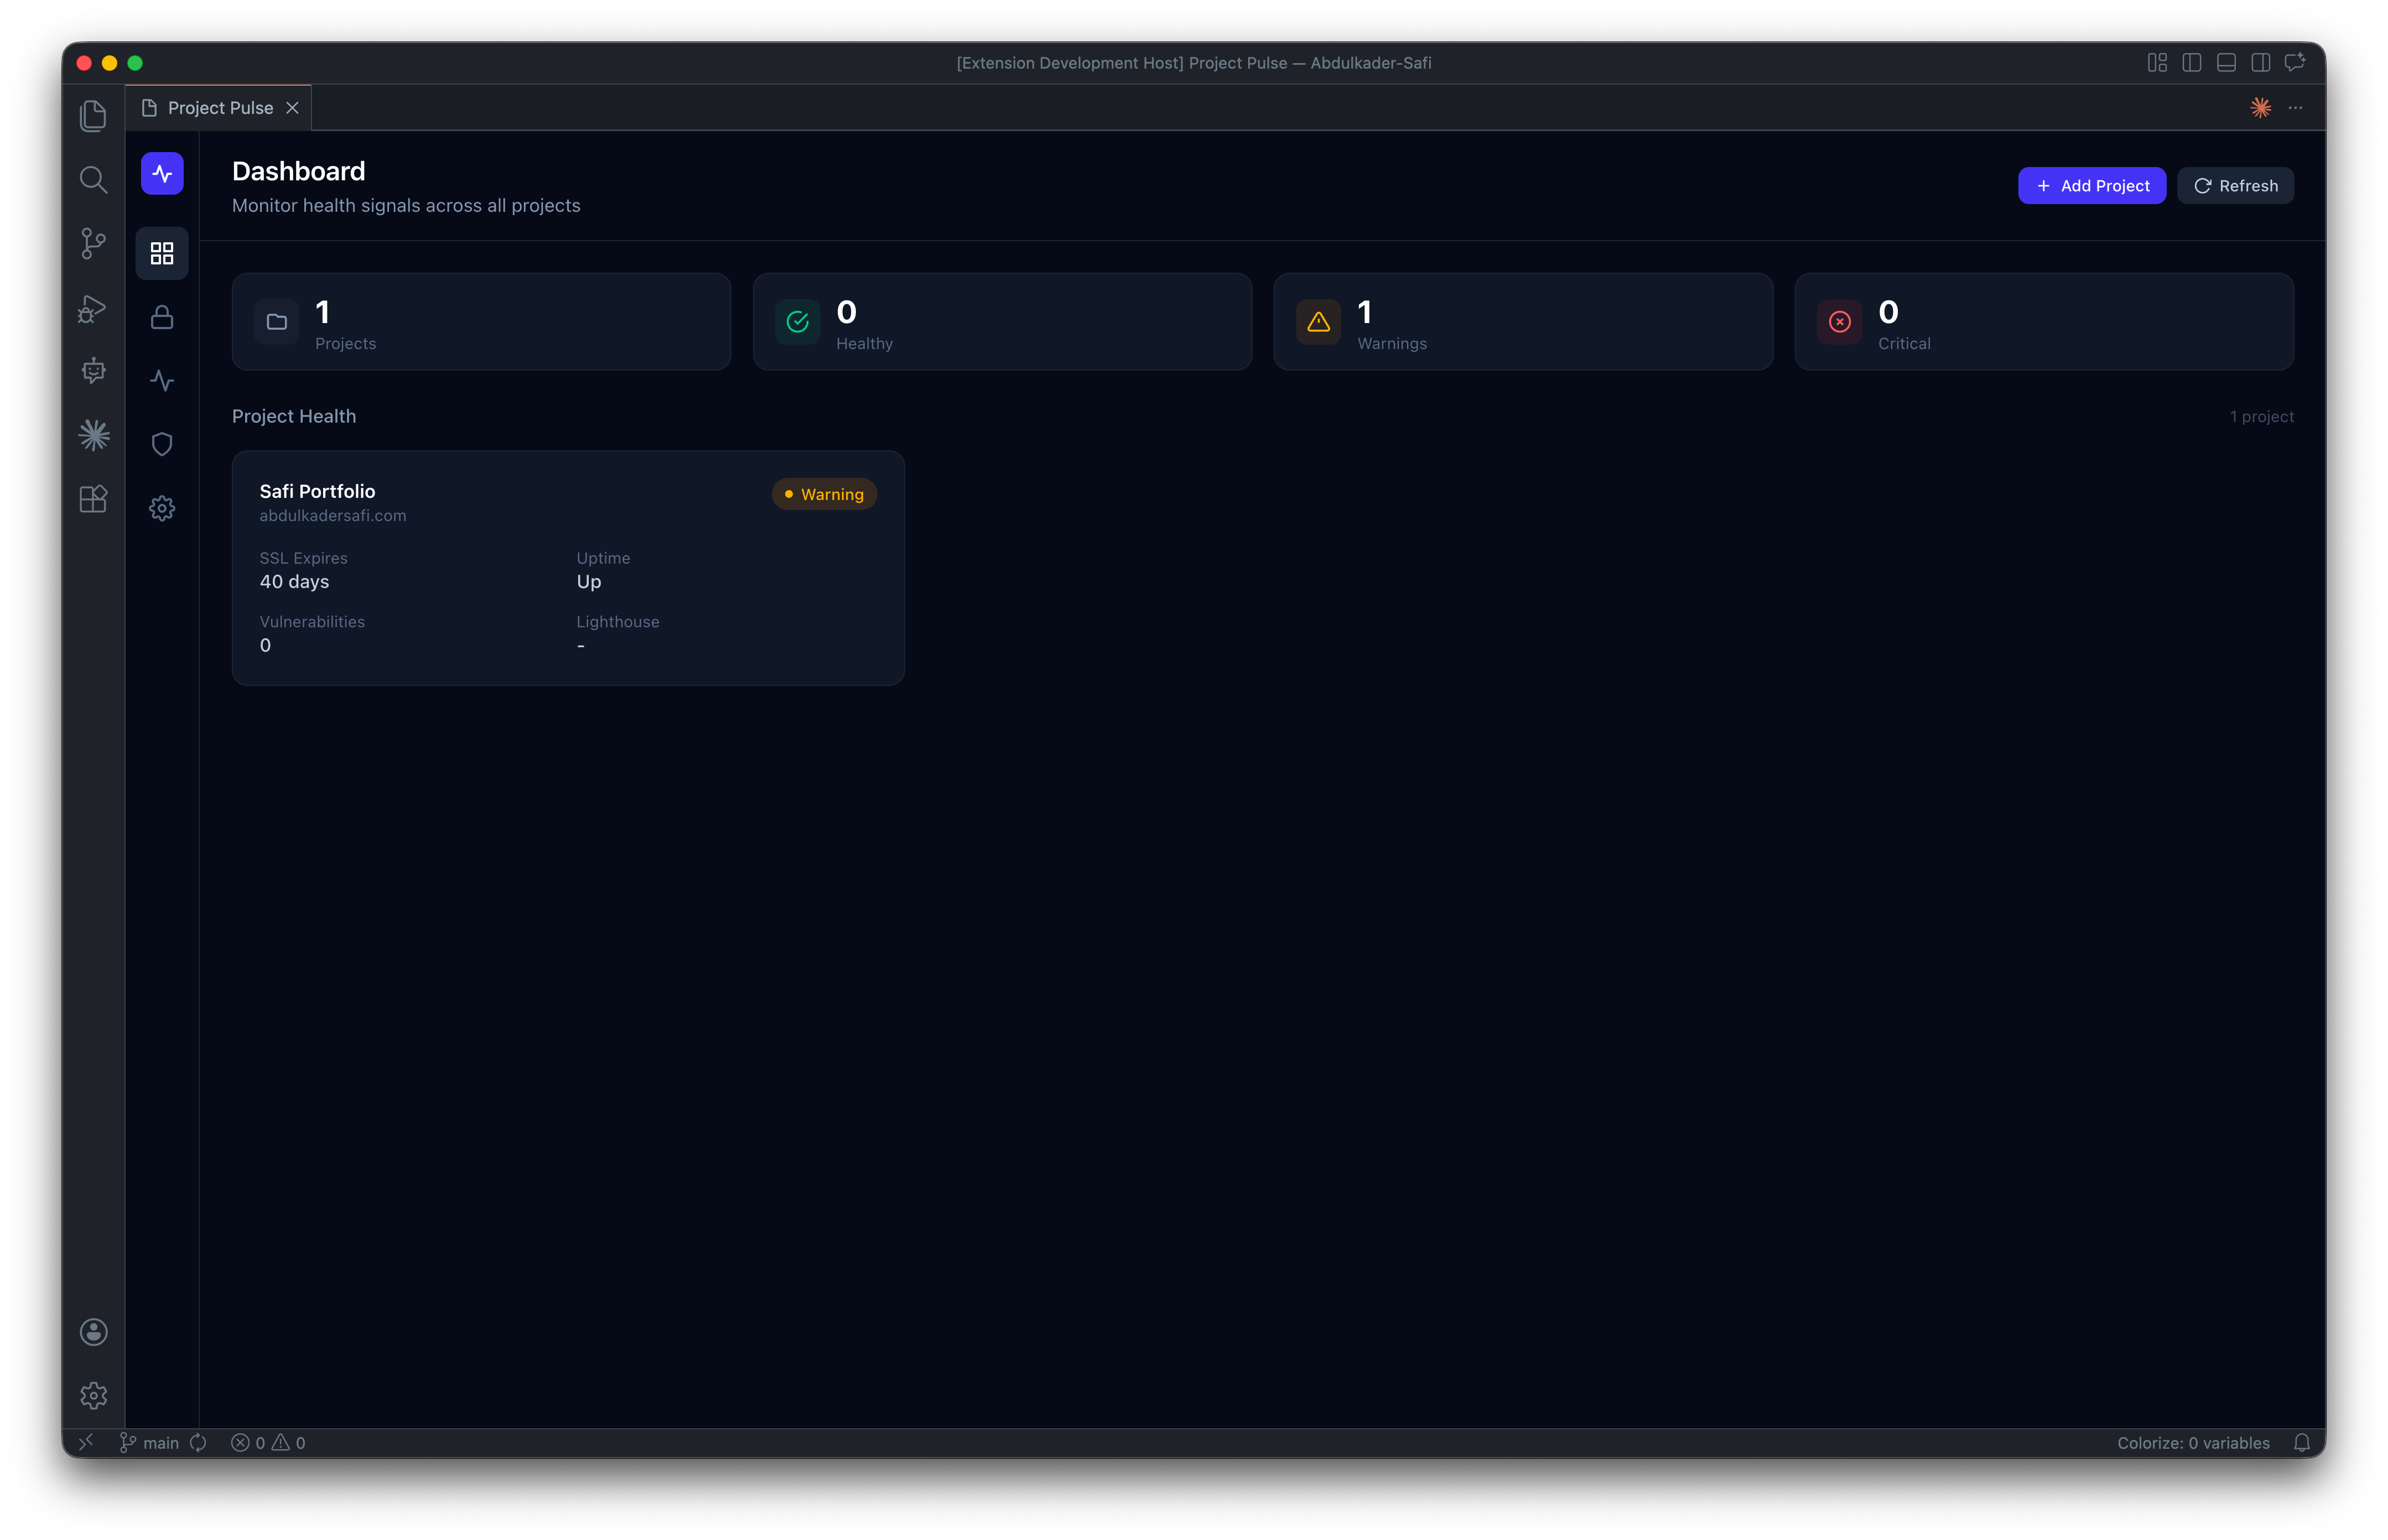
Project Pulse lives where the work happens — inside VS Code. Open your editor, open the dashboard, and every client project's health is one glance away.
How it works:
The extension runs two processes in parallel. A Node.js scheduler in the extension host continuously runs checks on configurable intervals (5–60 minutes per project), using built-in Node modules for SSL (tls), DNS (dns.Resolver), and HTTP (https) — zero external dependencies, zero network hops, zero subscription costs. The React webview renders a dark-themed dashboard with project health cards, drill-down detail views, and cross-project comparison tables.
Key design decisions that make it work:
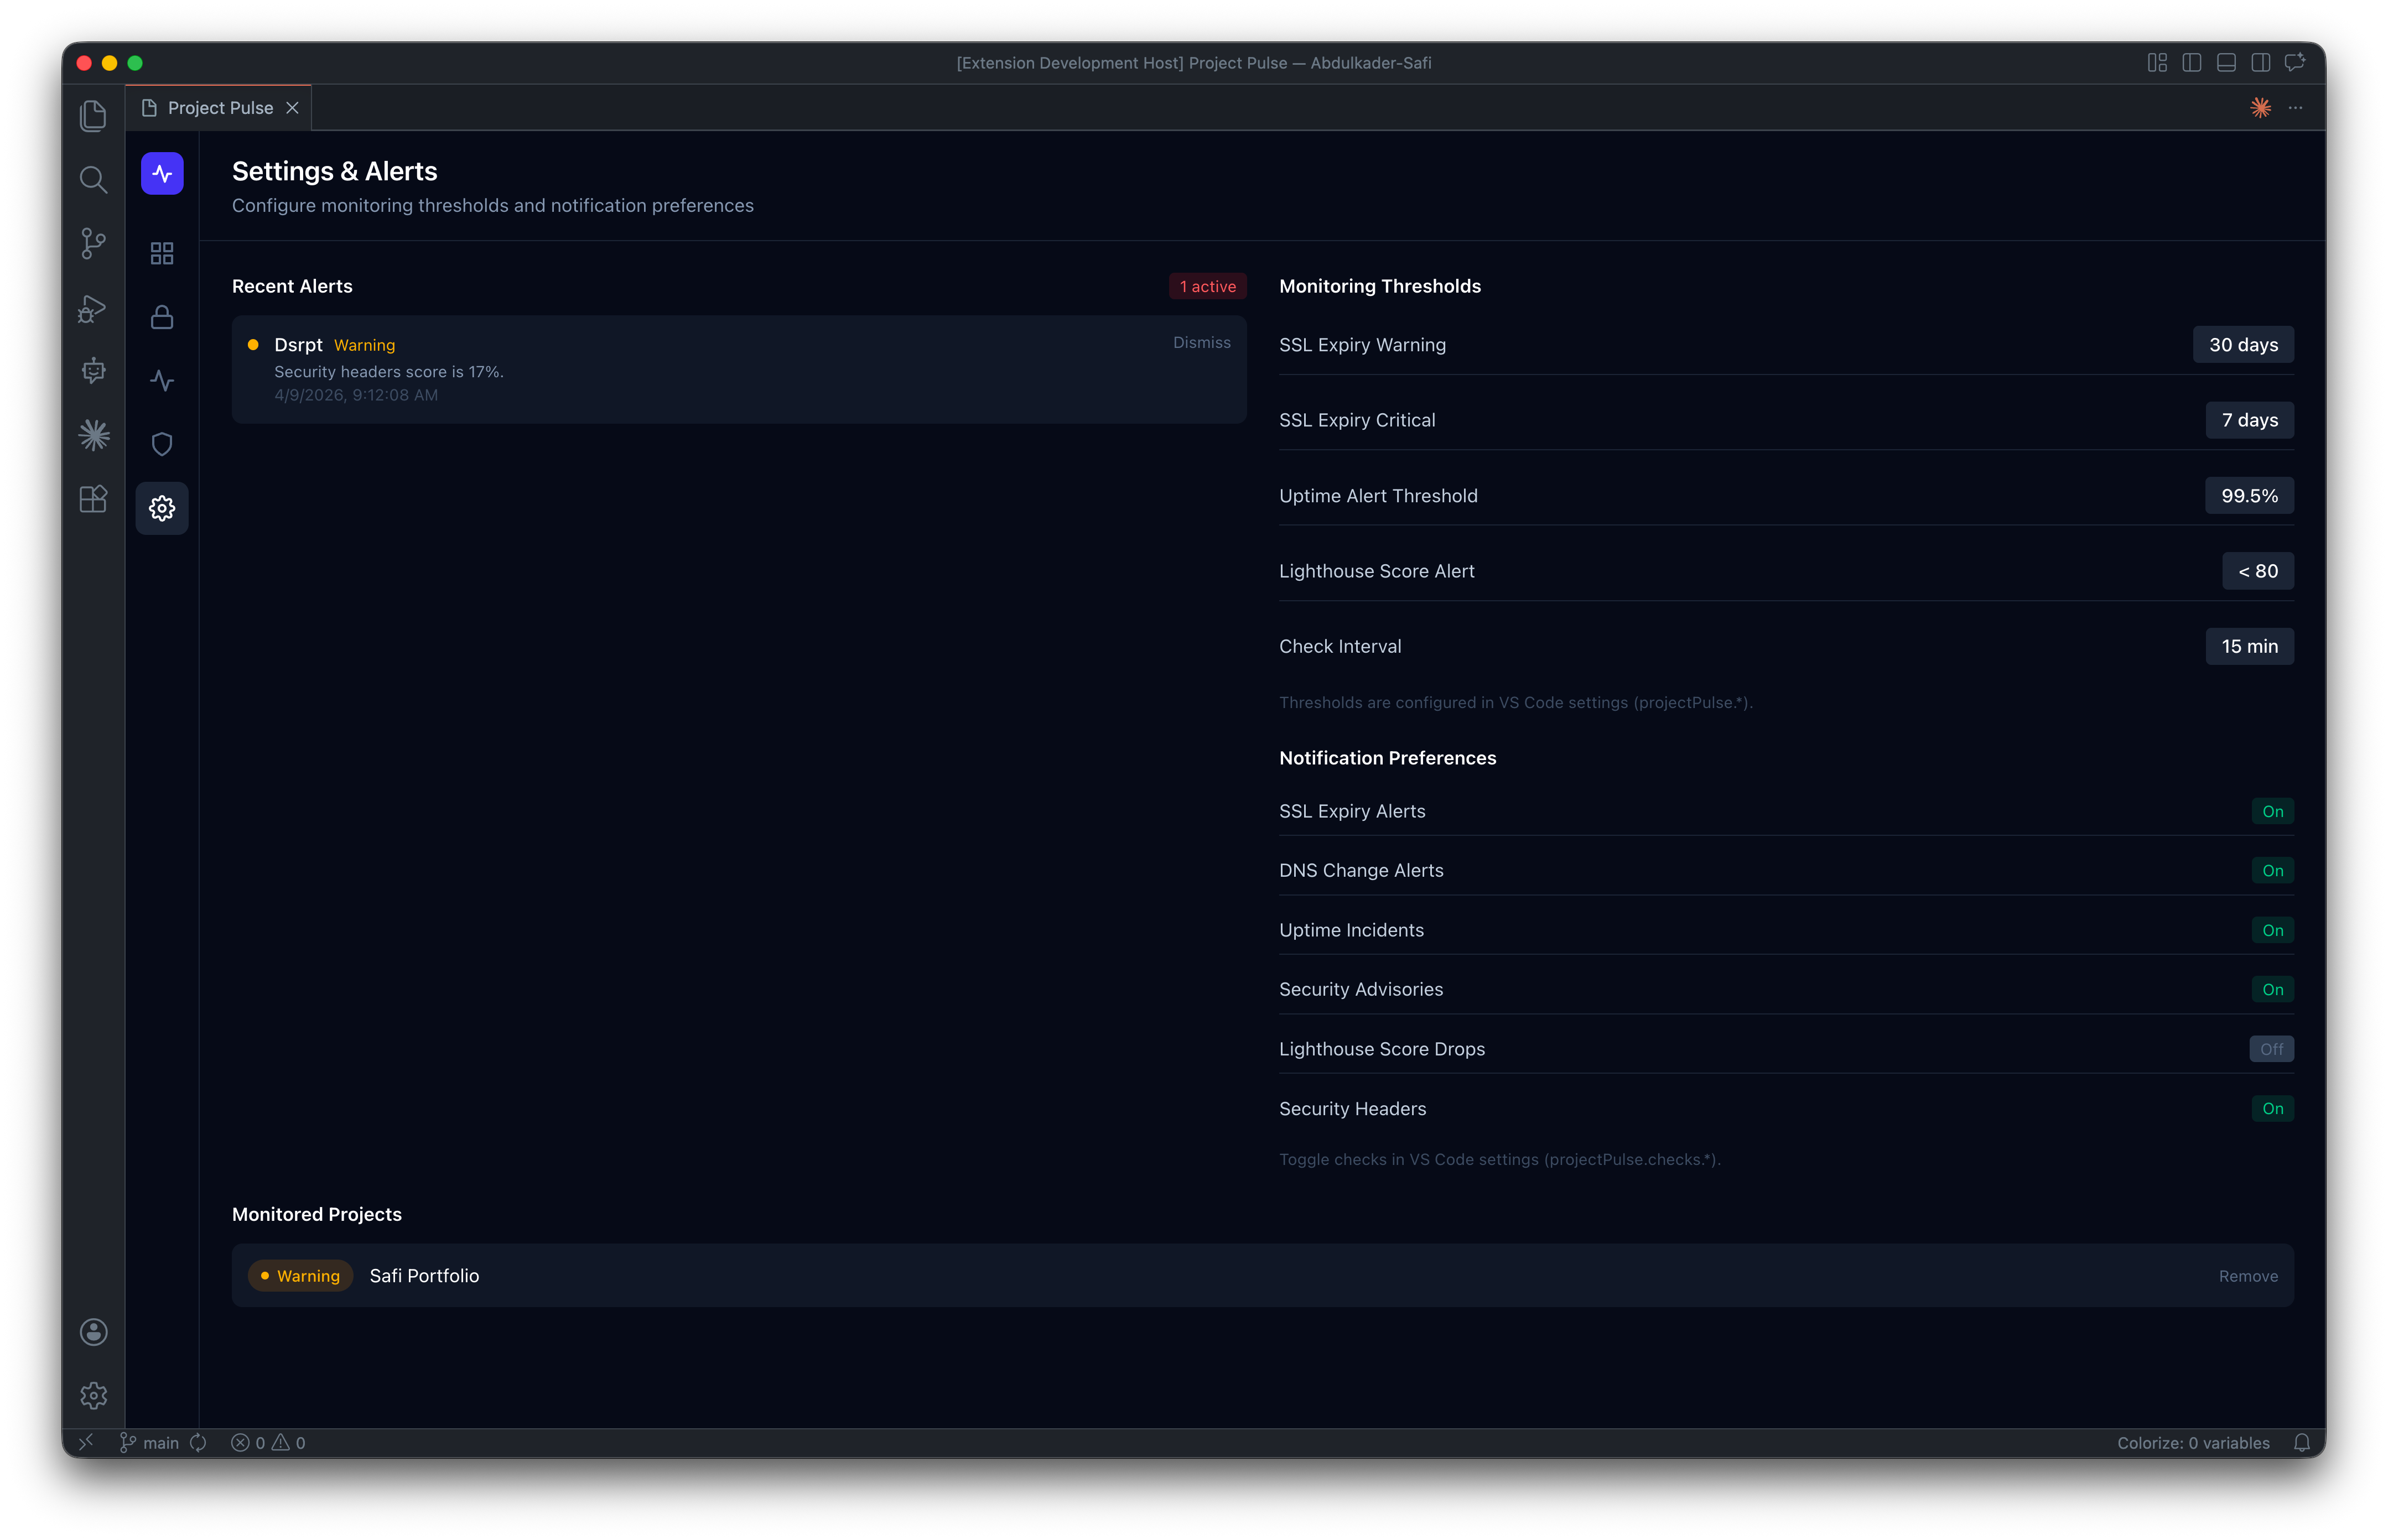
- Background-first architecture. Monitoring runs automatically from the moment VS Code opens. No manual triggers, no forgotten cron jobs. When a critical issue is detected (SSL expiring in under 7 days, site down, critical CVE), a native VS Code notification fires immediately.
- Everything in-process. All checks run inside the VS Code extension host — no external APIs for SSL/DNS/uptime (just Node.js built-ins), free OSV.dev API for vulnerability scanning, and free Google PageSpeed Insights API for Lighthouse (25,000 requests/day). Total infrastructure cost: $0.
- Local-first data. Project configurations live in VS Code's
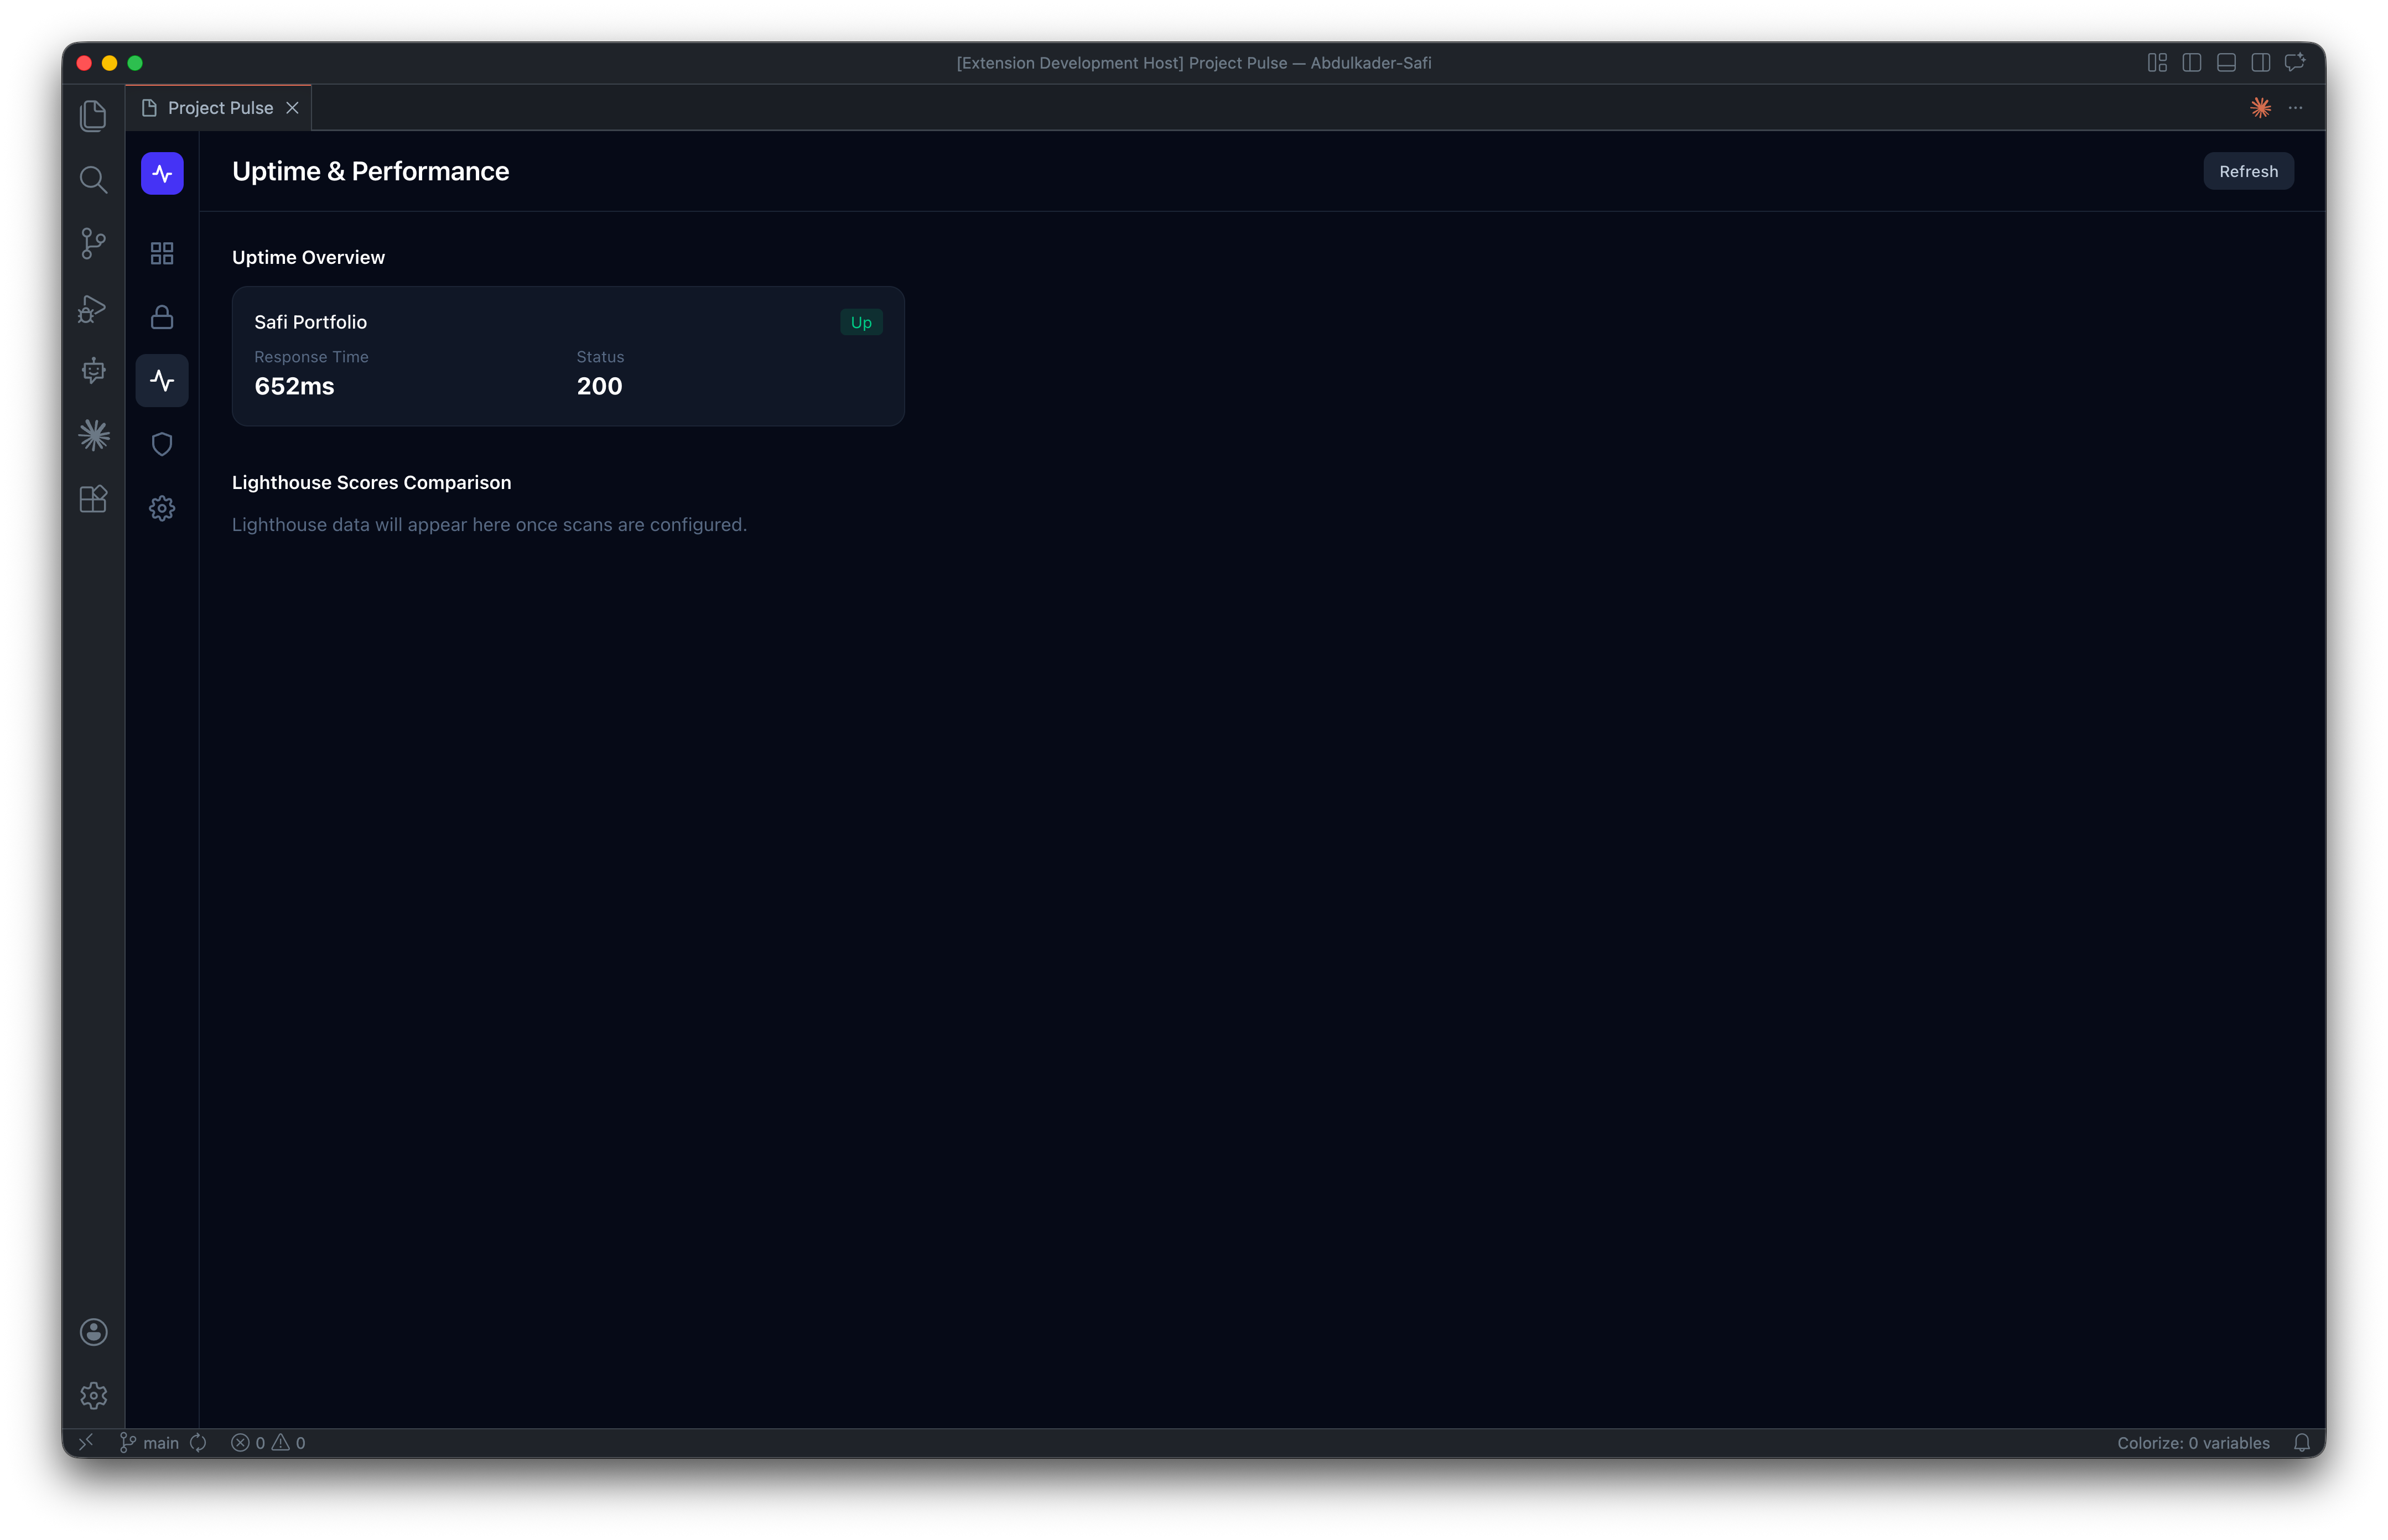
globalState; historical monitoring data persists as JSON files in~/.project-pulse/. Nothing leaves your machine, nothing syncs to a third-party service, no privacy concerns for client data. - Glance-able UX. The dashboard shows every project as a health card with SSL days remaining, uptime status, vulnerability count, and Lighthouse score at a glance. Click any card to drill into six detail panels (SSL, DNS, Uptime, Headers, Security, Lighthouse) with per-check run controls.
- 3-step add-project wizard. Drop in a URL, toggle which checks to run, review, done. Monitoring starts immediately.
Technical stack:
- Frontend: React 19 + Tailwind CSS v4 (dark-themed webview, hand-built SVG charts)
- Backend: Node.js built-in modules (
tls,dns,https,child_process) - Bundler: esbuild (sub-second rebuilds with in-process PostCSS)
- Type safety: TypeScript strict mode, discriminated union message protocol between webview and extension host
- Storage: VS Code
globalState+ local JSON history files
The result: a tool that catches the problems your clients would otherwise catch first — for zero ongoing cost, with zero context switching, and with zero data leaving your laptop.
About this project
-
Project Pulse is a VS Code extension that turns the editor into a command center for web project health. It continuously monitors six critical signals across every project you add: SSL certificates, DNS resolution, uptime, dependency security, Lighthouse performance, and HTTP security headers. When something goes wrong, like a certificate about to expire or a site going down, it fires a native VS Code notification so you can fix it before a client notices.
-
It is designed for agencies and freelance developers who juggle multiple client websites, often anywhere from five to fifty at once. Keeping all of those sites healthy manually is time-consuming and easy to skip, so the tool brings monitoring into the workspace where developers already spend their day. The goal is to catch problems before clients do.
-
The frontend is a dark-themed webview built with React 19 and Tailwind CSS v4, including hand-built SVG charts. The backend relies on Node.js built-in modules like tls, dns, https, and child_process to run checks in-process, and the whole project is written in TypeScript with strict mode. It bundles with esbuild and stores configuration in VS Code's globalState alongside local JSON history files.
-
Project Pulse runs entirely on your machine with zero external infrastructure and no subscription fees. SSL, DNS, and uptime checks use Node.js built-ins, vulnerability scanning uses the free OSV.dev API, and Lighthouse scores come from the free Google PageSpeed Insights API. Monitoring data persists locally, so nothing syncs to a third-party service and there are no privacy concerns for client data.
-
Enterprise tools like Datadog or Pingdom can cost hundreds of dollars a month and are overkill for small portfolios, while free uptime monitors typically cover only one signal rather than SSL, DNS, vulnerabilities, and performance together. Project Pulse combines all of these in one glance-able dashboard inside VS Code at no ongoing cost. The source code is on GitHub and there is a demo video on YouTube; the project was built over about a month and is currently in progress as of 2026.