Safi Studio Scanner 1.0.2: a report that carries numbers
The audit engine could tell you a check failed and nothing else, so there was nowhere to put a number. 1.0.2 adds a measurements channel, a streaming API so you can watch a crawl work, and a documentation site. Plus the head-parsing bug that made my social card invisible.

7 min read


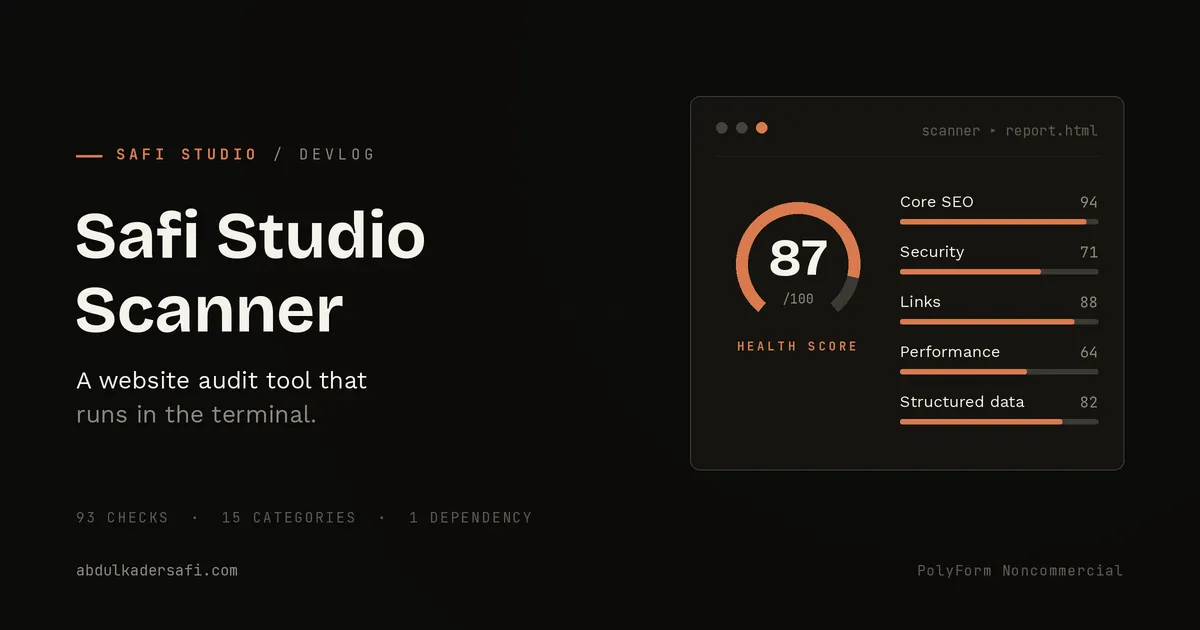
Safi Studio Scanner crawls a site, runs its checks, and hands back a score. Until this release, a check could tell you it failed, and that was the whole vocabulary. There was no way for the report to say a title is 82 characters long, because the report object had nowhere to put a number.
That was the gap in 1.0.2, and it was blocking most of the backlog. Roughly sixty items on my list are measurements rather than verdicts, and building any of them first would have meant building them twice.
Watch it run
If you would rather see it than read about it, here is the tool auditing a site end to end.
The rest of this post is what changed under it.
Two channels instead of one
A page report now carries findings and measurements side by side.
const report = await audit("https://example.com");
report.pages[0].findings; // verdicts, these move the score
report.pages[0].metrics;  // values and tables, these never do
The second half is the new part. A measurement carries its own status, one of ok, warn, bad or missing, and it is excluded from scoring entirely. That exclusion is the point. A report can now be as detailed as I like without diluting what a failing rule means, and I never have to invent a fake rule just to hang a number on.
Twenty-four measurements ship in this release. The one I reach for most is the duplicate-link table: one row per URL, listing every distinct anchor that points at it. A page can link /pricing three times, once as "Pricing", once as "pricing page", once as "the plans", and no per-link list will show you that, because each row looks fine on its own. On one row it is obvious in a second.
The rest are the things you would check by hand: the heading outline in document order with what each section contains, the full Open Graph and Twitter tables with every tag marked present or missing, image alt coverage counting alt="" separately from a missing attribute, resolved crawl directives including whether the canonical actually points at the page that was audited.
Tables cap at 25 rows and report the real total, so a report says "showing 25 of 340" rather than quietly cutting the list short and letting you think you saw everything.
Thirty-four seconds of silence
The other half of the release came from running the thing on my own site. Four pages, 348 checks, 34 seconds, and for all 34 of them the terminal printed nothing. A working audit and a hung one looked identical.
So I added a streaming API. I did not design the shape of it. I copied the one every LLM SDK already uses, because it is the shape people have seen before: typed events with a type field, an async iterator as the main way to read them, .on(type, handler) to subscribe to one kind, and one accumulated result you can await at the end.
import { auditStream } from "safi-studio-scanner";

const stream = auditStream("https://example.com", { maxPages: 20 });

for await (const event of stream) {
  if (event.type === "page_complete") {
    console.log(`${event.index}/${event.pagesTotal}  ${event.url}  ${event.score}/100`);
  }
}

const report = await stream.finalReport();
Seven events, from audit_start through to audit_complete, which carries the finished report. Two of them give you a progress fraction directly.
I deliberately did not add an option to configure which events you receive, even though that was the first thing I reached for. Subscribing is the filter. .on("page_complete", handler) says exactly what you want, and a config option on top would have been a second way to do the same job.
The counter that would have stalled at half
One detail took longer than the rest of the streaming work. The check counter needs a denominator, and the obvious one is wrong.
Rules multiplied by pages overcounts, because rules that need a rendered page are skipped on pages that were never rendered. If you run a static audit against the twelve performance rules, six of them never execute. Compute the total up front and the progress bar climbs to fifty percent and stops there forever, which looks exactly like a crash.
So the total is computed after the crawl and the render stage, once it is known which pages actually have browser data attached. There is a test that runs the performance category alone and asserts the total is six and that six checks fire, because that is the kind of thing that quietly regresses.
Two bugs worth naming
The first one had been live for a week without me noticing. I built a social card for the docs site, wired up the og:image tags, deployed, pasted the link into WhatsApp, and got a preview with no image. I spent a while blaming the file size, converted the PNG to a JPEG, got it under 140KB, and still nothing.
The actual cause was in the markup. rspress renders a head config entry given as a tuple into <tag attrs> with no closing tag. My analytics <script> was declared that way, so it never closed, and the browser parsed everything after it as script content. Every meta tag I had added below that line was inside an unterminated script. The checker was right that og:image was missing. It genuinely was not in the head. Declaring the script as a raw string with its own closing tag fixed it, and I now verify that page with an HTML parser rather than a grep, because grep finds the tag whether or not it is inside a script.
The second was smaller and entirely my fault. The HTML report had drifted into its own palette, cream and clay, with fonts pulled from Google Fonts. The docs site is near-black with one yellow accent. Same product, two identities. Restyling the report onto the brand also turned up two real defects: the tables had a border-radius that never did anything, because a table with border-collapse: collapse cannot clip its own corners, and at phone widths the data tables crushed "og:description" into three letters a line instead of scrolling. Both had been shipping for as long as the report had.
The docs
The engine now has a documentation site rather than a long README. The two pages that took the most work are the ones that did not exist before this release: a catalog of every measurement with what each one reports, and a streaming page with a copy-paste terminal progress bar and a React example.
That second one was a deliberate choice. A feature that exists but is not obvious in the docs may as well not exist, and progress reporting is exactly the kind of thing someone only looks for after they have already sat through a silent crawl and assumed it hung.
Where it is
npm install safi-studio-scanner. Node 18 or newer, ESM, MIT, one runtime dependency at the core. 94 checks across 15 categories, three output formats, and now a measurement channel underneath all of it.
Docs are at safi-studio-scanner.abdulkadersafi.com, the code is on GitHub, and npm run example in the repository runs a live progress bar against any URL you give it.
Phase 2 is a text and readability engine: a tokenizer with stop words and n-grams, which pays for text statistics, a top-words table, a keyword relevance matrix, and a rewrite of the keyword-stuffing rule. One module, four report sections. It is the best ratio left on the list.
Last updated 17 Aug 2026 · filed under Typescript, tools, seo, website audit